Dashboard
The Dashboard tab gives you a simple, comprehensive, and objective snapshot of your security status and provides associated metrics. These aggregated results and statuses are presented in manageable chunks of visual information that enable you to see what is going well, what needs improvement, and if necessary, where action is required. To access your Dashboard:
- Ensure that you are logged into your Botguard account.
- In the BotGuard user interface (UI), click Dashboard from the main navigation menu bar.

- In the secondary menu bar, the tab Today displays by default. Optionally, change the period in scope by clicking one of the other tabs: This month, This week, or Yesterday.
-
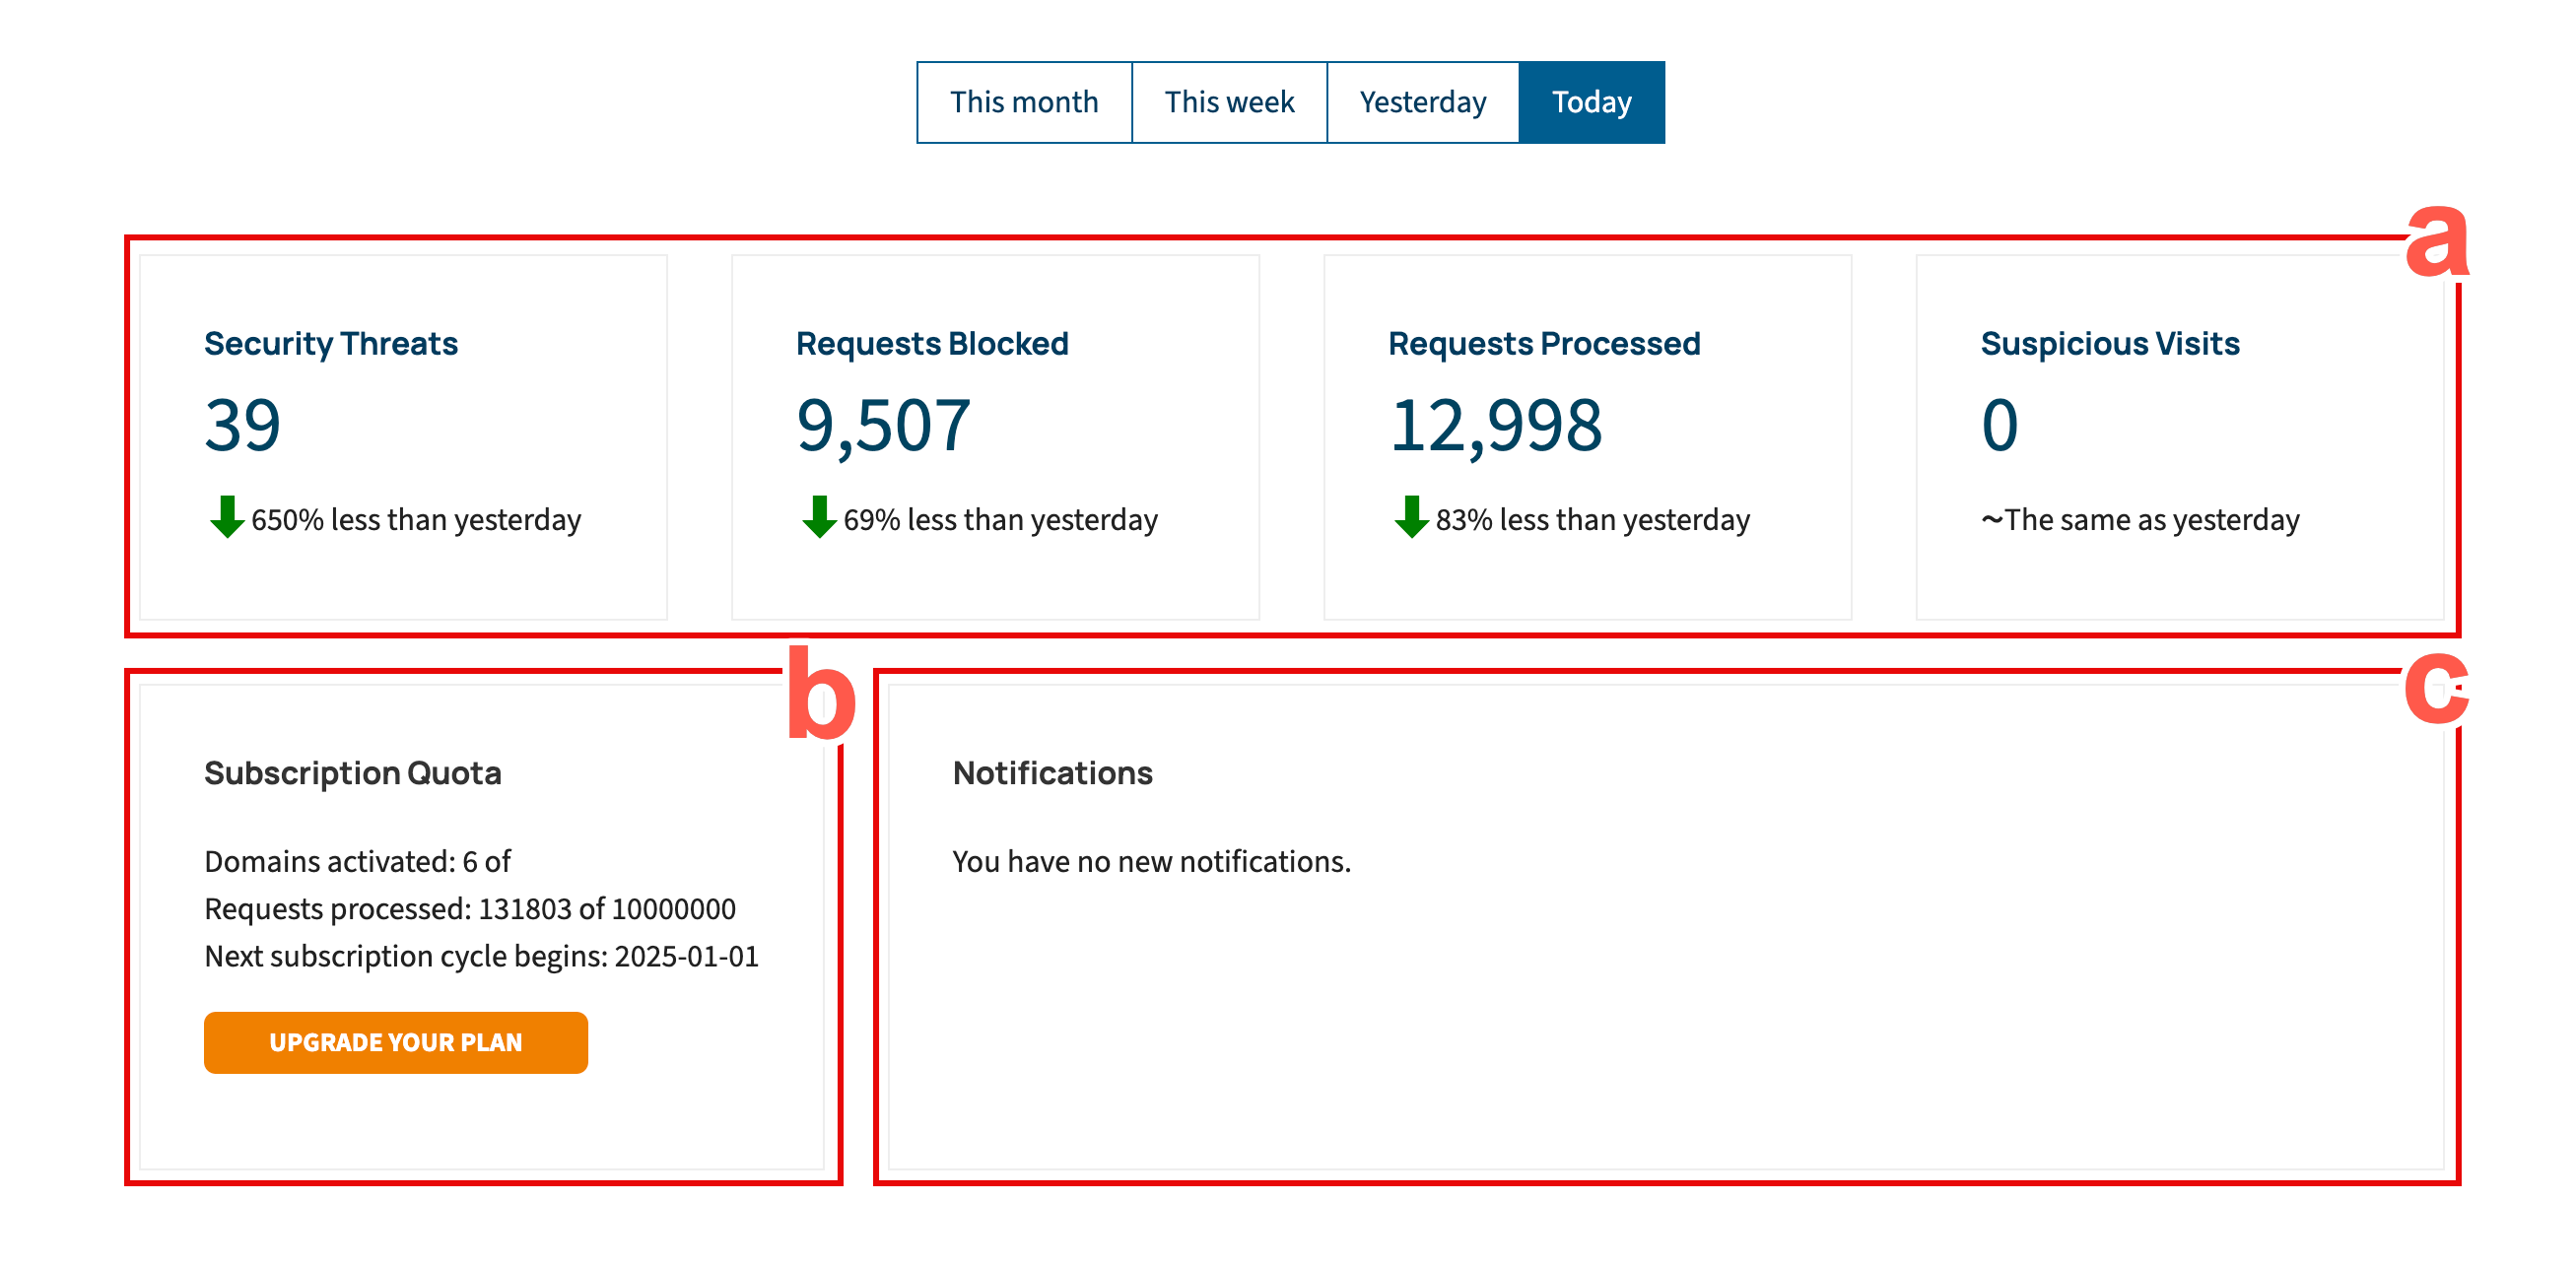
Use the widgets displayed at the tope of the page to keep up to date on your security metrics. The table after this image details all the widgets and provides a summary of each.
Annotation Description a This set of widgets provides the top-level metrics about BotGuard's protection of your assets. This includes the number of Security Threats, Requests Blocked, Requests Processed, and Suspicious Visits within the time period defined. A percentage figure is also provided to show how much the each metric as increased or descreased since the previous similar period. b The Subscription Quota widget provides information about the number of domains registered in your account, the number of requests processed in this current subscription period, and the start date of the next subscription cycle. Finally, you can click UPGRADE YOUR PLAN to upgrade your current BotGuard plan. c The Notifications widget displays important notifications related to your account. In this example, there are none to display. -
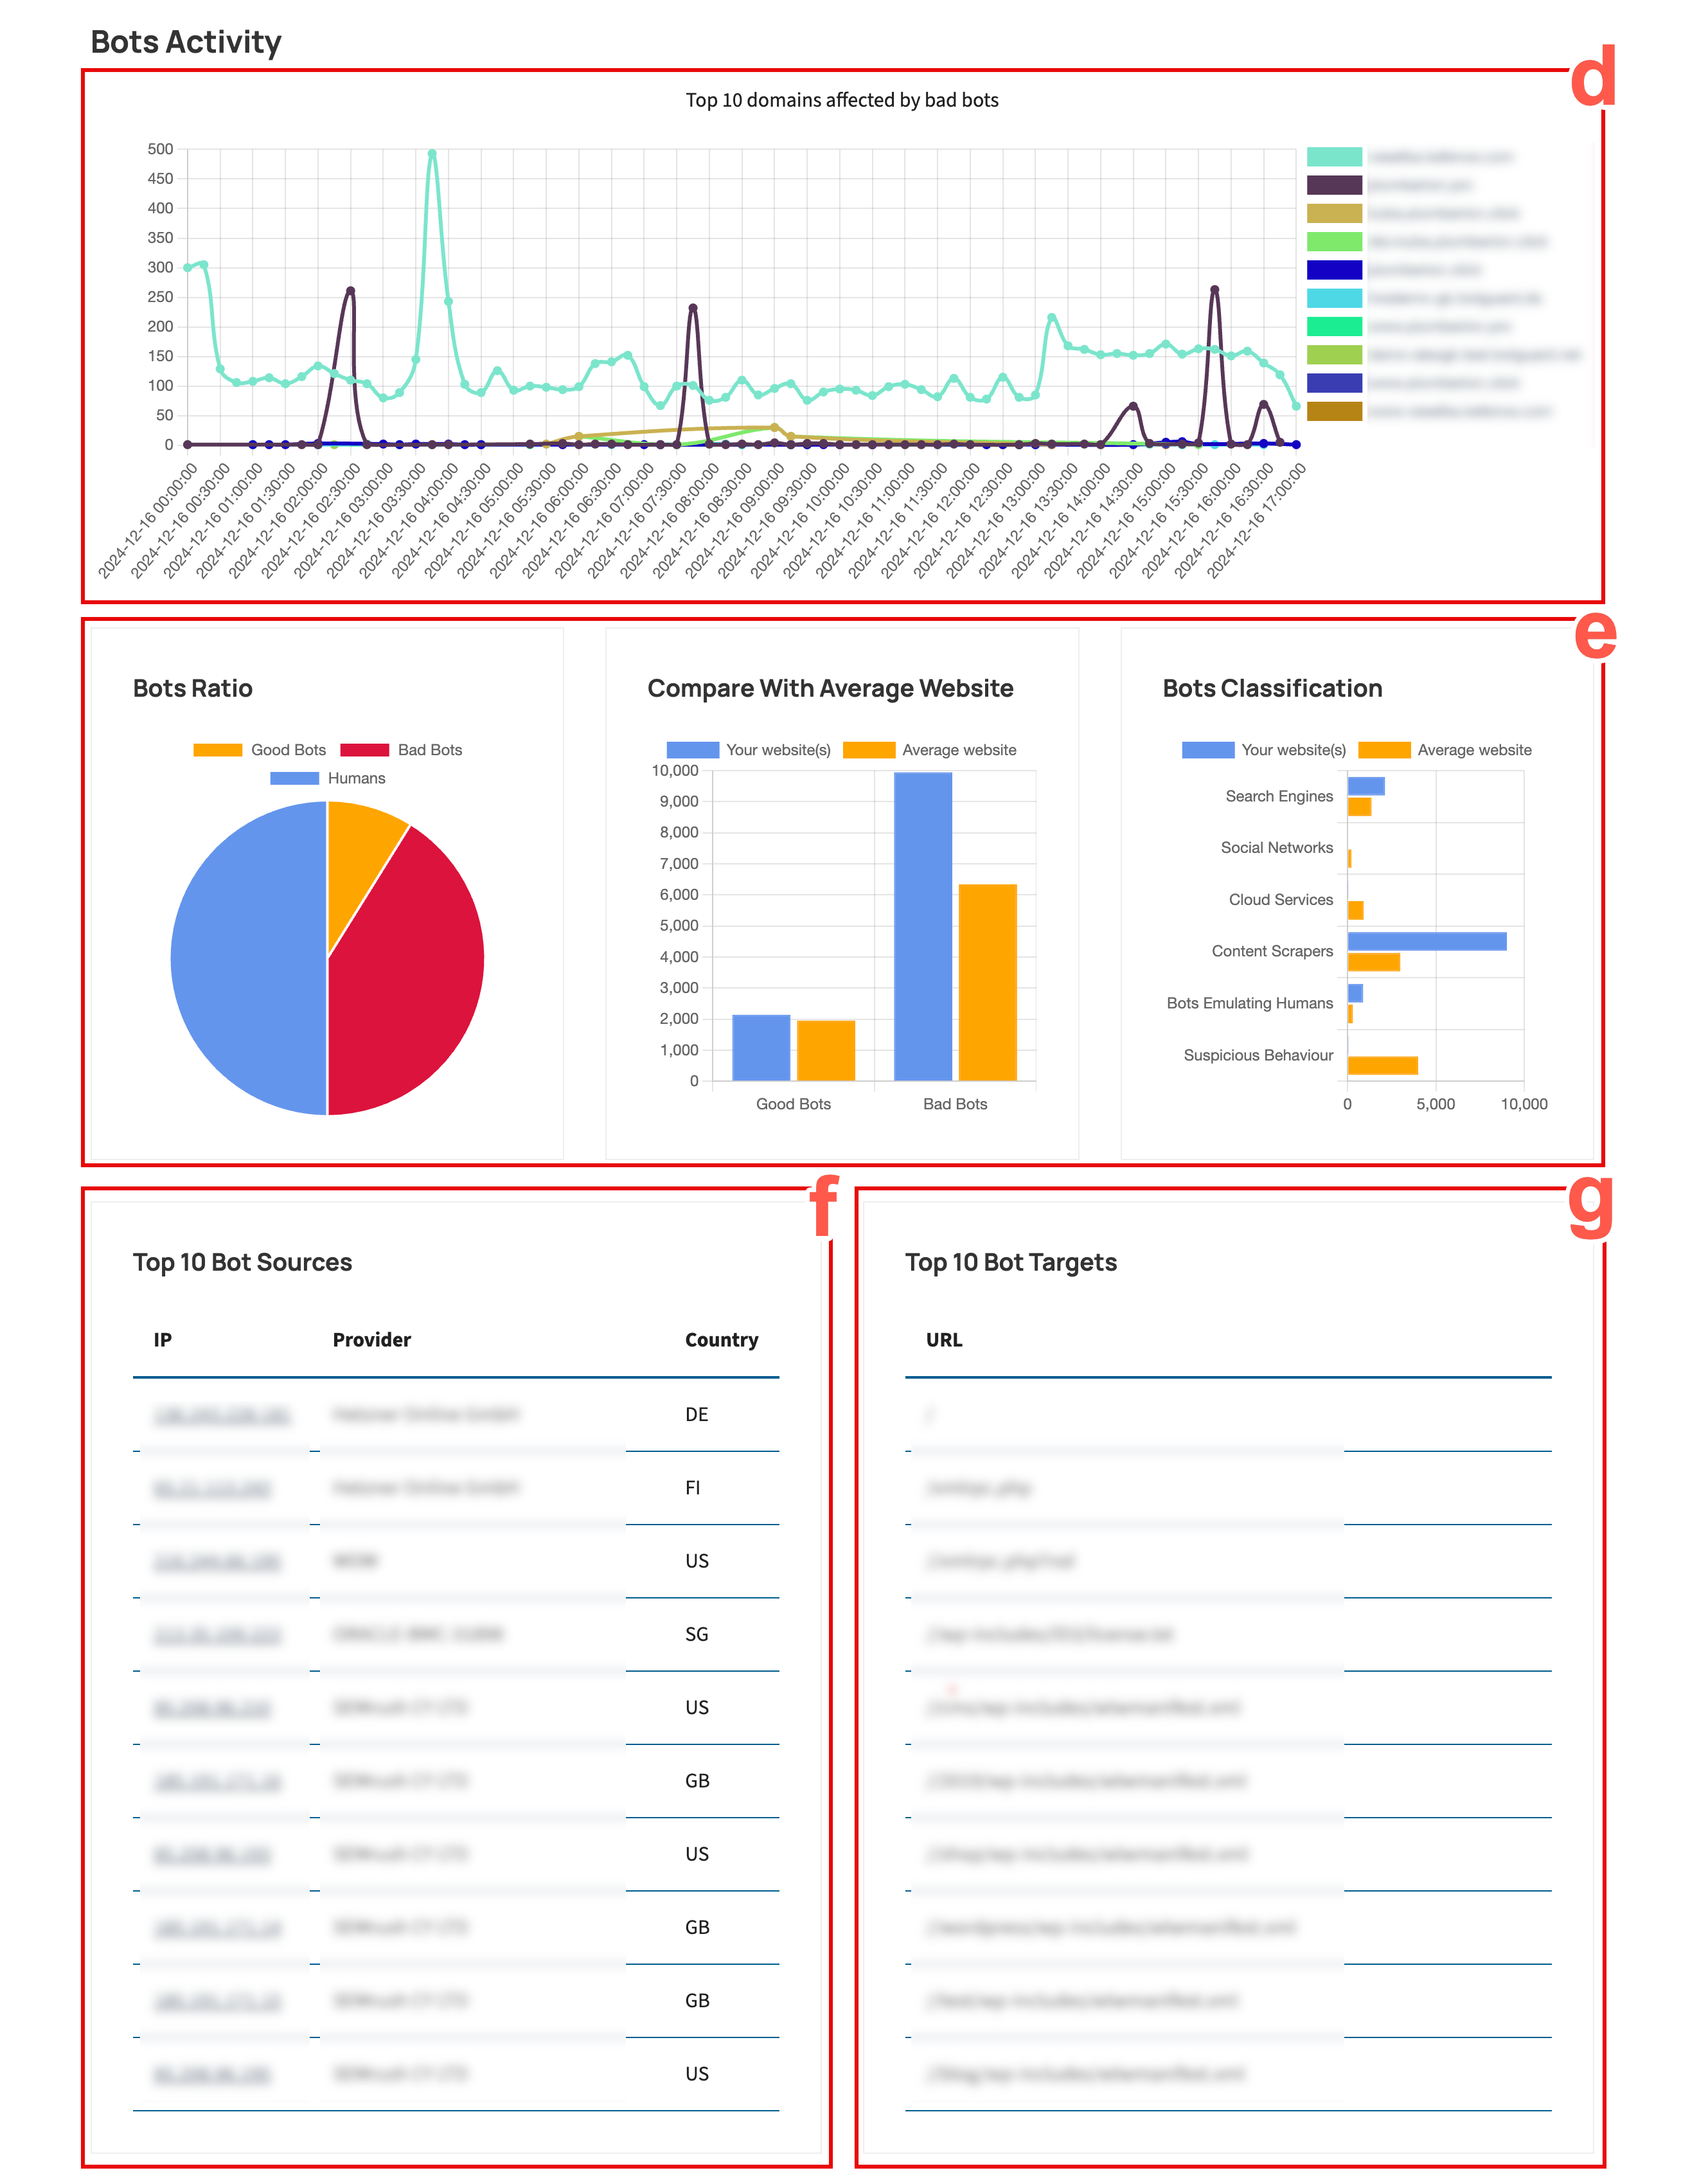
Use the widgets displayed centrally on the page to learn more about the types of threats that make up the metrics for your assets.

Annotation Description d The Bots Activity widget presents a graphical display of the threat levels processed over the time period selected, for the top ten affected domains in your account. e This first of this set of three widgets displays the Bots Ratio, which provides a graphical breakdown of Good Bot versus Bad Bot versus Humans interactions with your web assets. The second and third widgets in this set provide a comparison of how Your website(s) compares with Average website values for Good Bot versus Bad Bot and a breakdown of bot classifications respectively. f The top ten bot sources interacting with your website(s), including their IP address, Provider, and the Country of origin. g A shortlist of the top ten target URLs in your website(s) for bot activity. -
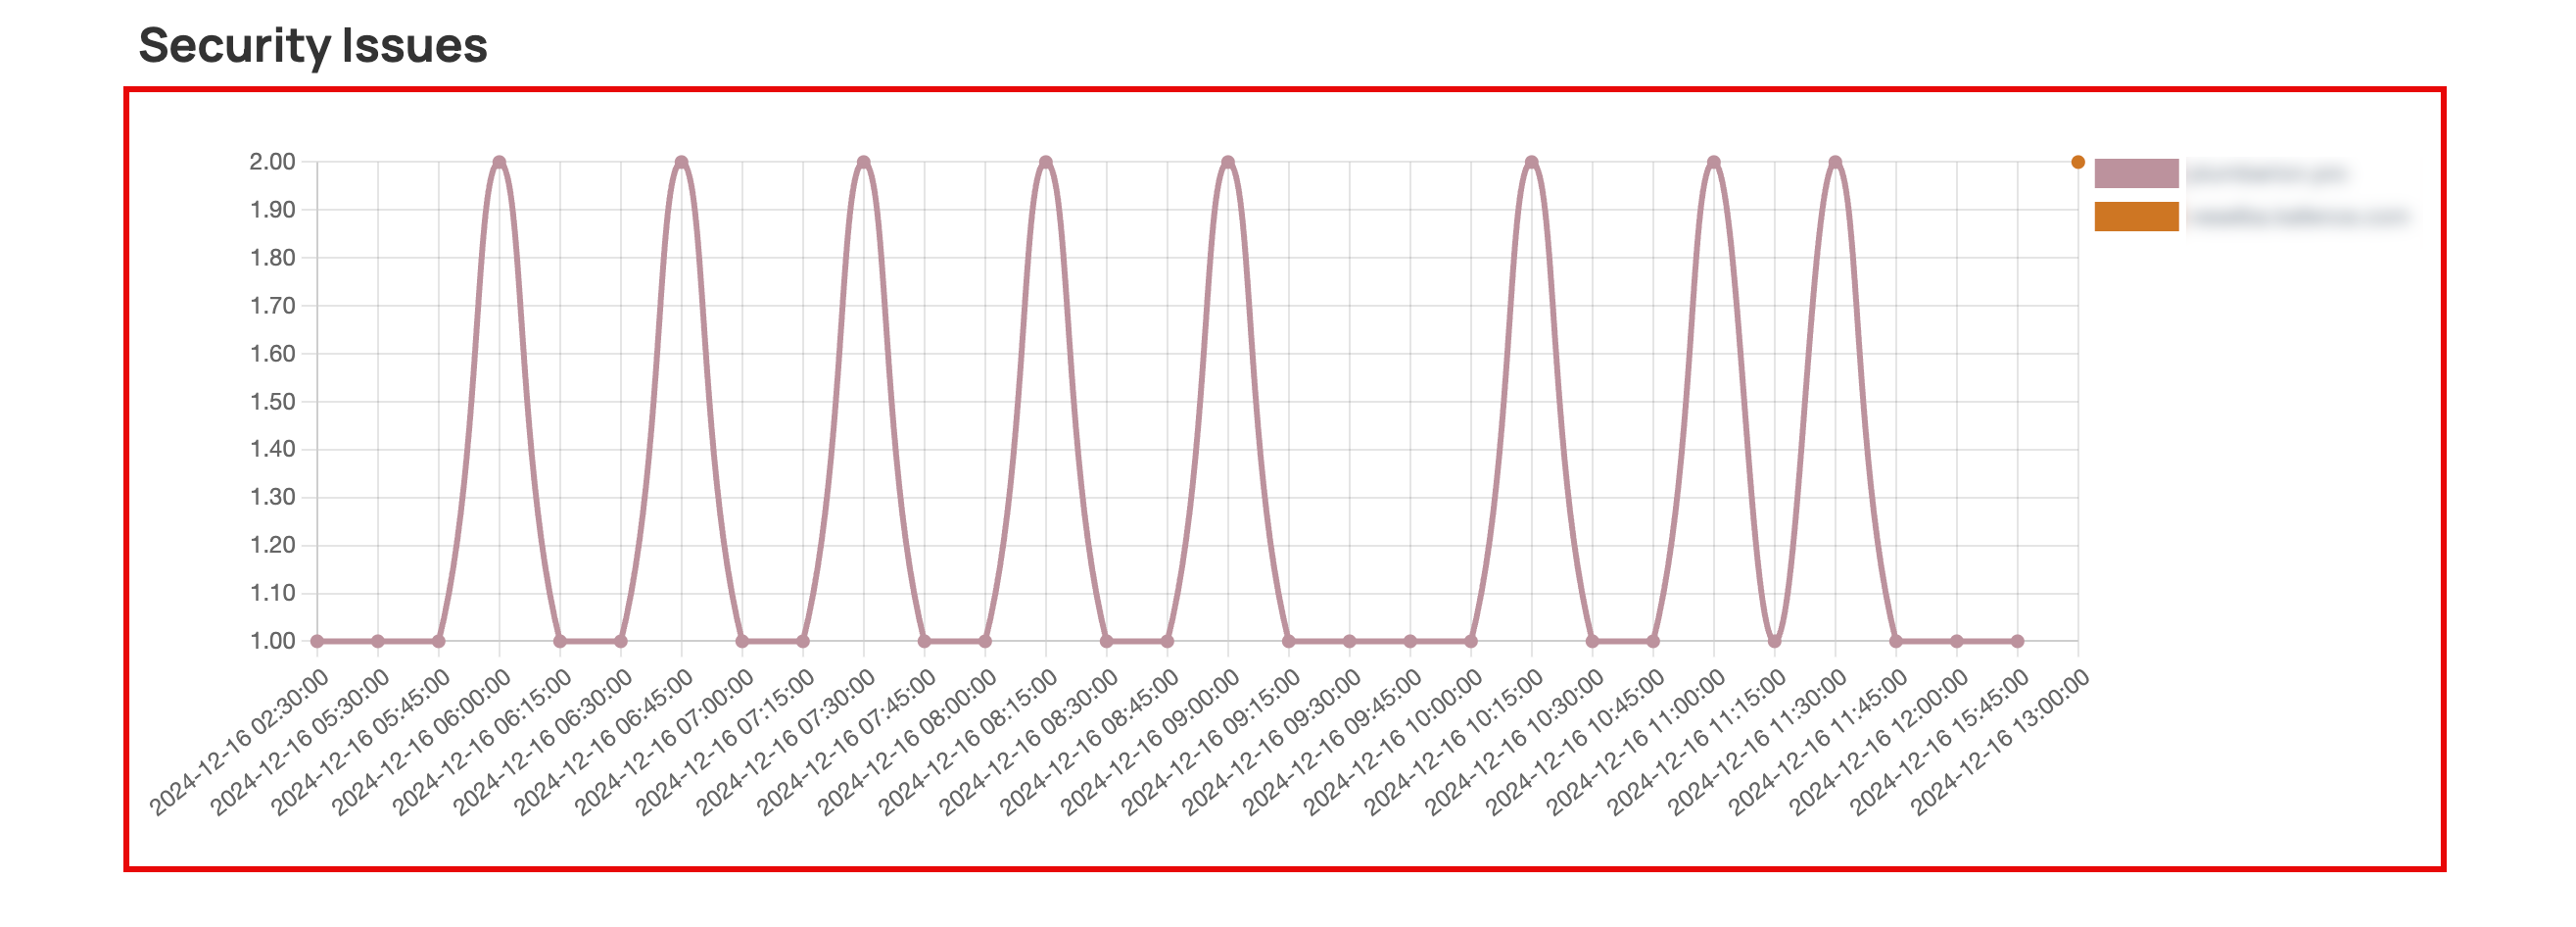
Use the last widget displayed in your Dashboard to identify notable security issues and their frequency over the time period selected.

